Create customizable dashboards for each of your offerings with AccessAlly Metrics Dashboard. Place User progress metrics such as Quiz, Time to completion of a course alongside Sales metrics to give a comprehensive view of how your products are doing and digging deeper into the success of your most profitable products.
This guide will give you a high level overview of what you can track with the Metrics Dashboard.
ARTICLE CONTENT:
Create a New Dashboard
You can easily create multiple dashboards to organize your metrics. With the button, a dashboard can be created blank or with some default metrics*. You will have complete freedom to add or delete metric items either way.
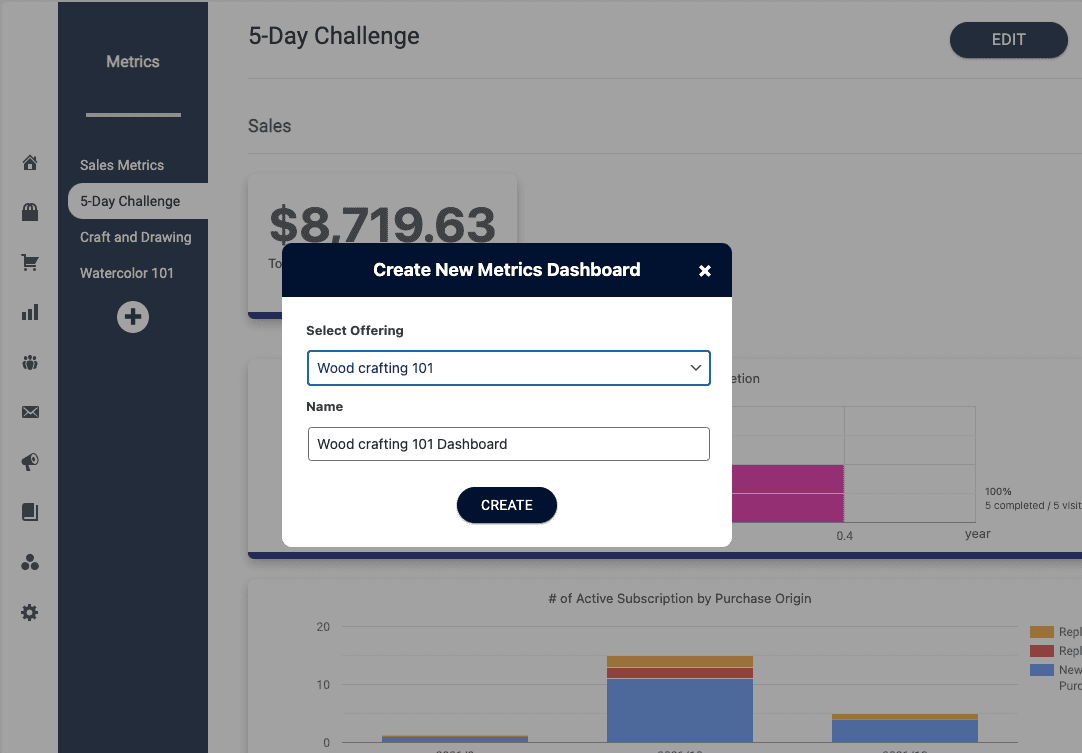
The default metrics for an offering are: Total Revenue, Monthly # of Sales, Payment next month, Overall Course Completion, and Time to Completion of this offering. You can add and remove metrics as you’d like!
Sales and Progress Metrics
Start tracking the sales and progress metrics that matter the most to your business organization.
AccessAlly includes a metrics dashboard, where you can track the membership site statistics that are most important to your business, from revenue and sales numbers to the average customer value.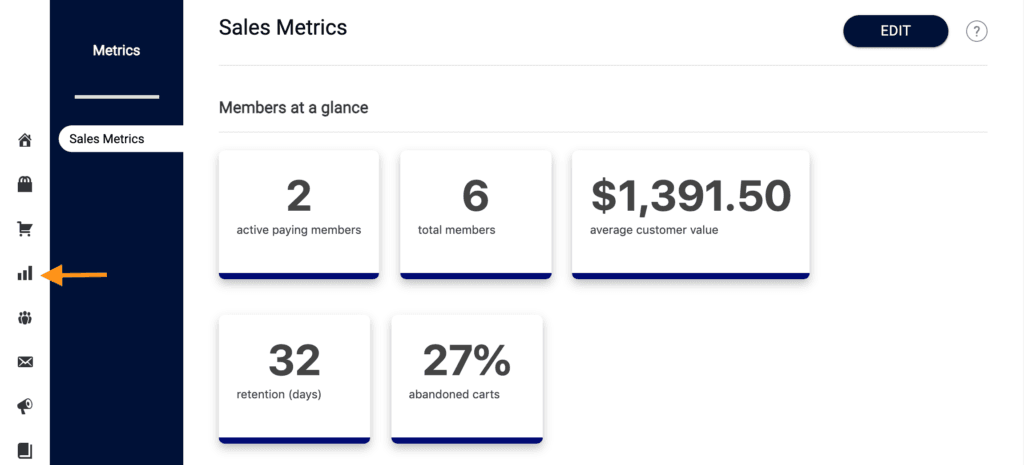
To view the list of available metrics you can track, please see this tutorial: List of Metrics Available In AccessAlly
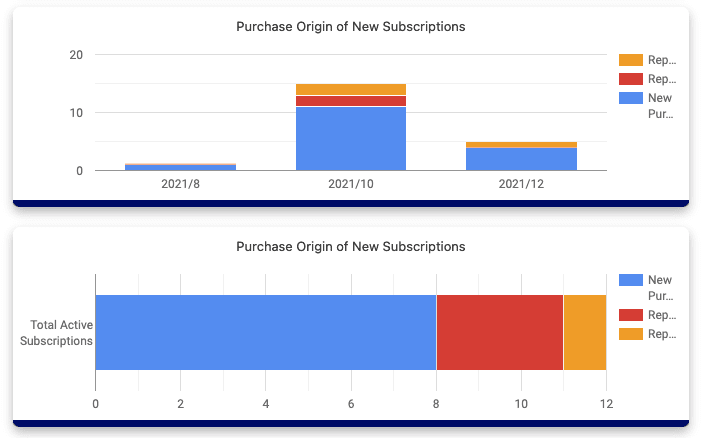
Purchase Origin of New Subscriptions
The New Subscription by Purchase Origin is particularly useful when you have different tiers of product and want to track how many people are upgrading. This shows the number of new subscribers and where they come from.
Progress Metrics
You might also be wondering which courses are getting through to your audience effectively and which are not. With AccessAlly Metrics Dashboard you now can visualize user progress on a page / course by tracking Page views, Time to Completion, Quiz responses and so much more!
Time to Completion
The Time to Completion metrics can be used to track page or offering completion times. The duration is tracked in days. It will also show you the total number of users compared to the completed users on the right side of the graph.
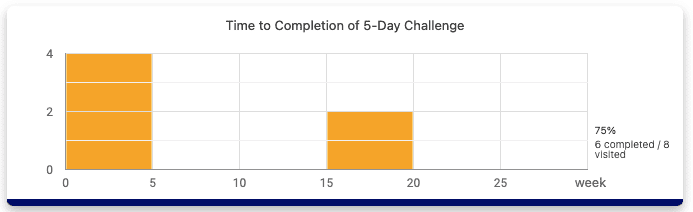
In the above sample graph, we can see that there are 4 users who’ve completed the course within 5 weeks while one user spent around 15 – 20 weeks. On the right hand side, we can also see that there are 2 users yet to complete this course.
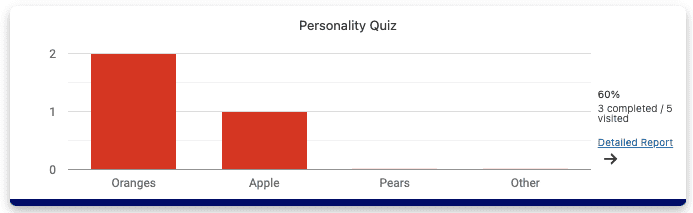
Quiz
The Quiz metric shows the user result distribution for all type of quizzes (personality quiz, graded quiz, points quiz). To view the detailed report of this quiz, follow the link on the right hand side to ProgressAlly Reports.
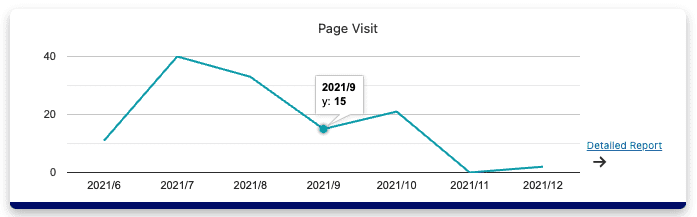
Page Visits
Page visit metric tracks the number of visitors to a page. To view and download a completed log of users who’ve accessed this page, simply follow the link on the right hand side to ProgressAlly Reports.
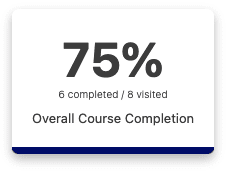
Overall Course Completion
The Overall Course Completion ratio is the proportion of users who’ve completed this course out of the total number of users with access to this course.